Statistical Models and Data Analysis for Champions League Betting
 Available in US
Statistical modeling transforms football betting from subjective opinion into quantified probability assessment. Rather than asking “who will win?” models ask “what probability distribution describes likely outcomes?” This shift enables systematic comparison between model-derived probabilities and bookmaker odds, identifying discrepancies that represent potential value. Champions League betting presents specific modeling challenges – smaller sample sizes than domestic leagues, cross-competition comparisons, and knockout format complications – but also opportunities where statistical rigor can outperform intuition.
The foundation of sports betting modeling rests on a simple principle: if you can estimate probabilities more accurately than bookmakers, you can identify value bets that profit over time. Bookmakers set odds based on their own probability assessments plus margins; when your probability estimate exceeds the implied probability from odds after accounting for margin, value exists. Statistical models provide the framework for generating consistent, defensible probability estimates.
Building effective models requires understanding both statistical techniques and football’s specific characteristics. Goals are relatively rare events compared to points in basketball or runs in baseball; matches can end in draws unlike binary American sports outcomes; home advantage affects results systematically. These features shape which statistical approaches apply and how models must be adapted for football’s specific dynamics.
Table of Contents
The Poisson Distribution Foundation
The Poisson distribution provides the mathematical foundation for most football prediction models. This probability distribution describes the likelihood of a given number of events occurring in a fixed interval when events occur independently at a known average rate. Goals in football matches approximately follow Poisson distributions, making this tool directly applicable to scoreline prediction.
To apply Poisson modeling, calculate expected goals for each team based on their attacking strength and opponent’s defensive weakness. A team averaging 1.8 goals per home match facing a team that concedes 1.4 goals per away match might expect to score approximately 1.6 goals (the geometric combination of these rates adjusted for league averages). Similarly calculate the opponent’s expected goals. These two expected goal figures become the lambda parameters for Poisson distributions.
Once you have expected goals for each team, the Poisson distribution generates probability estimates for every possible scoreline. The probability of a 2-1 home win equals the probability of the home team scoring exactly 2 (from their Poisson distribution) multiplied by the probability of the away team scoring exactly 1 (from their distribution). Summing probabilities across all scorelines where home goals exceed away goals gives home win probability; equal goals gives draw probability; away exceeds home gives away win probability.
This framework extends naturally to goals markets. Over 2.5 goals probability equals the sum of probabilities for all scorelines where total goals exceed 2.5. Both teams to score probability equals total probability minus the sum of clean sheet probabilities for either side. Correct score probabilities come directly from the model’s scoreline distribution.
Model Inputs and Data Sources
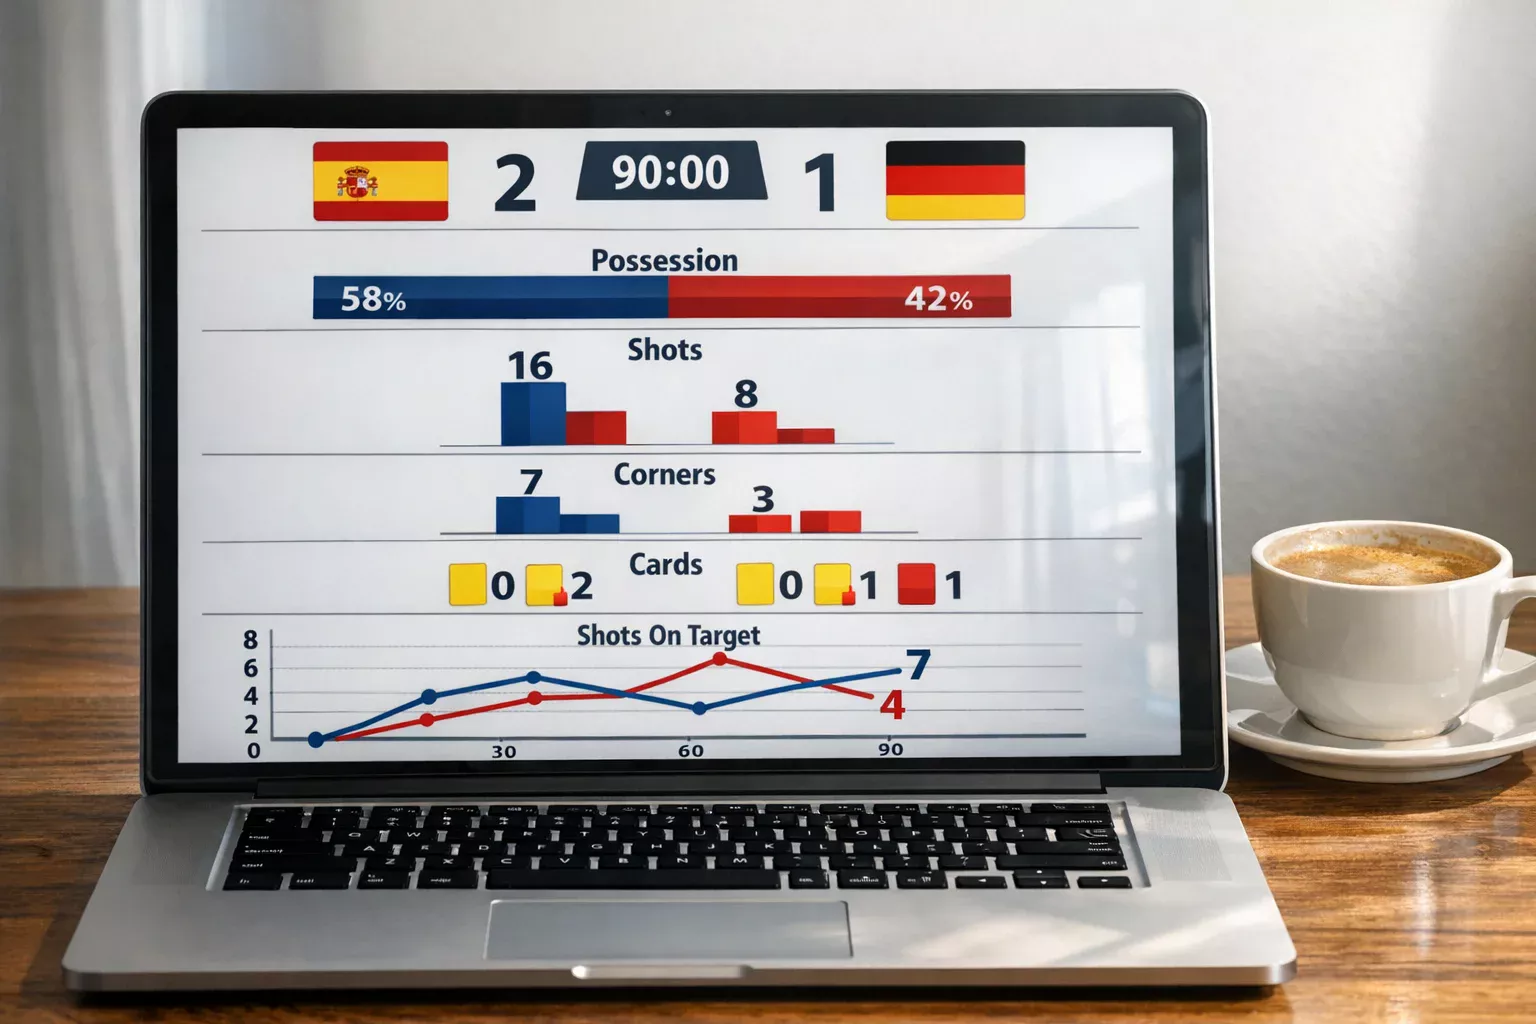
Attack and defense strength ratings form the core inputs for Poisson models. Calculate these by comparing team performance against league averages. A team scoring 1.5 goals per home match when the league average is 1.4 has an attack rating of approximately 1.07 (1.5/1.4). A team conceding 1.0 goals per home match when the league average is 1.2 has a defense rating of approximately 0.83 (1.0/1.2).
Expected goals can incorporate recent performance weighting to capture form. Rather than using full-season averages, weight recent matches more heavily – perhaps giving the last five matches double the weight of earlier results. This captures form shifts while maintaining sufficient sample size for stable estimates.
Data sources for model building include public results databases, expected goals statistics from providers like Opta or StatsBomb, and detailed match statistics. Football-Data.co.uk provides free historical results for major leagues. Expected goals data adds sophistication by measuring chance quality rather than just outcomes, capturing performance better than raw goals.
For Champions League modeling, combine domestic league data with European results. Teams enter the tournament with domestic performance histories that inform baseline ratings; European results update these ratings for continental competition. Account for the different competitive environment – Champions League opposition quality typically exceeds domestic league averages.
Model Limitations and Adjustments
Basic Poisson models assume goals are independent events, but this assumption does not perfectly hold. When a team scores, match dynamics change – the trailing team attacks more urgently while the leading team might defend more conservatively. This interdependence means actual scoreline distributions differ slightly from pure Poisson predictions.
The Poisson distribution tends to underestimate draw probability and overestimate high-scoring outcomes. A team expected to score 1.5 goals has some probability of scoring 5 or more under Poisson assumptions, but tactical realities (teams protecting leads, match fitness limitations) make extreme scorelines rarer than pure Poisson suggests. Some modelers apply “draw inflation” adjustments or cap maximum predicted goals to address these biases.
Home advantage must be incorporated explicitly. Teams score more and concede less at home due to crowd support, familiar environments, and travel fatigue for visitors. Model home advantage as a multiplier on attack ratings at home and defense ratings away, calibrated to observed home advantage levels in target competitions.
Quality differential affects model accuracy. Basic Poisson models based on league averages work well for matches between similarly-ranked teams but can misestimate when strong teams face weak opponents. The assumption that goals are independent breaks down more severely in mismatches where one team dominates possession and the other rarely threatens.
Expected Goals Integration
Modern football analysis has increasingly adopted expected goals (xG) as a superior measure of performance compared to actual goals. Expected goals assigns probability values to each shot based on historical conversion rates from similar situations, capturing chance quality rather than just quantity.
Integrating xG into prediction models improves accuracy by separating signal from noise. A team that scores 10 goals from 8.0 xG has been lucky; one scoring 6 goals from 8.0 xG has been unlucky. Using xG rather than actual goals as model inputs captures underlying performance that will persist better than variance-influenced actual goals.
For Champions League modeling, xG data helps address small sample size challenges. With only six to eight European matches per season before knockout rounds, raw goal counts provide limited information. Expected goals from domestic competitions supplement European data, enabling more stable team quality assessments.
Building xG-based models requires access to shot-level data or pre-calculated team xG figures. Several public sources provide xG data for major leagues; subscription services offer more comprehensive coverage. The analytical investment in xG-based modeling typically produces more accurate predictions than goals-based approaches alone.
Building Your Own Model
Start with publicly available data and simple Poisson models before adding complexity. Download historical results, calculate attack and defense ratings, and generate match predictions. Compare your predictions against actual outcomes to evaluate model performance before risking real money.
Track your model’s calibration – how well predicted probabilities match observed frequencies. If your model predicts 30% for certain outcomes, those outcomes should occur approximately 30% of the time across many predictions. Systematic miscalibration indicates model problems requiring adjustment.
Compare model outputs against bookmaker odds to identify potential value. Convert odds to implied probabilities, subtract estimated margin, and compare against your model’s probabilities. When your model gives substantially higher probability than implied odds suggest, potential value exists – though your model might also simply be wrong.
Backtest model performance against historical data before live betting. Apply your model to past seasons and track how betting on identified value would have performed. Positive historical performance does not guarantee future success, but negative backtesting results indicate problems requiring resolution.
Champions League Modeling Challenges
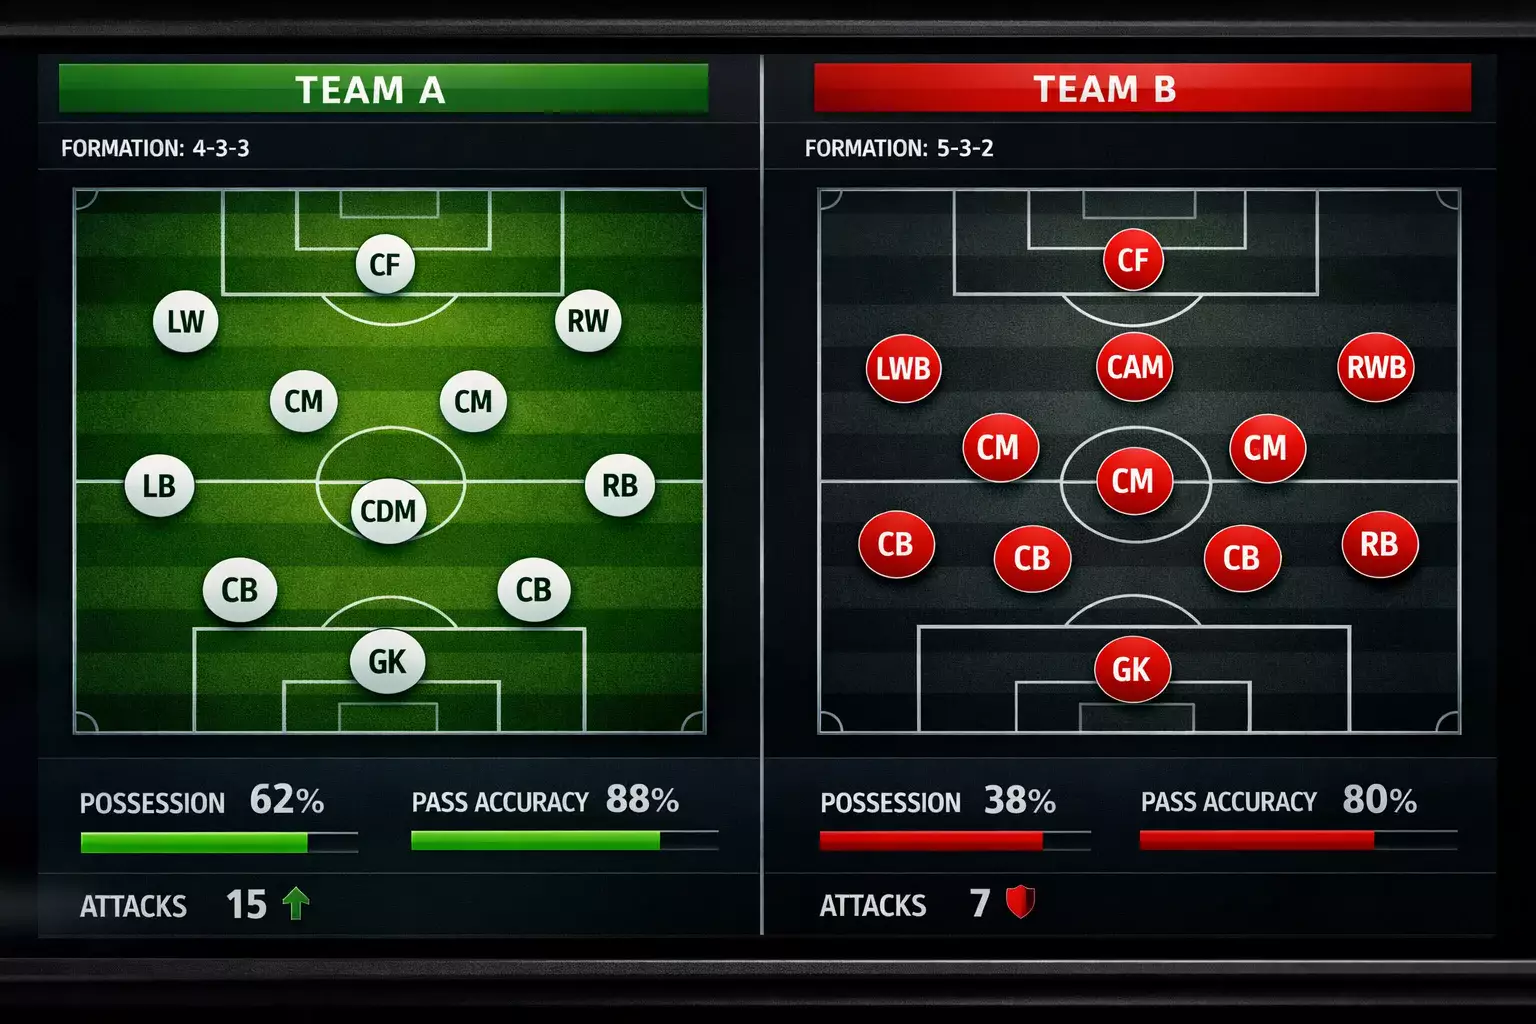
European competition introduces cross-league comparison challenges. How does a team’s domestic performance translate to continental competition? Bundesliga attacking statistics might not directly compare to Serie A figures due to different league characteristics. Account for league strength adjustments when modeling Champions League matches between teams from different competitions.
Sample sizes in European competition are small. A team might play only eight to twelve Champions League matches per season; basing predictions solely on European results produces unstable estimates. Blend domestic and European data, perhaps weighting European results more heavily while using domestic data for baseline quality assessment.
The knockout format creates modeling complications. Two-leg ties with aggregate scoring differ from single matches; extra time and penalties resolve draws in knockout rounds. Extend basic models to account for aggregate dynamics, including how trailing teams behave in second legs and extra time goal expectations.
Tournament progression changes the competitive environment. Knockout rounds feature exclusively strong teams that survived the league phase; the quality distribution narrows as the tournament advances. Models calibrated on full Champions League samples might underestimate knockout round competitiveness where all remaining teams are elite.
Practical Implementation
Decide whether to build models from scratch or use available tools. Building your own models provides maximum customization but requires significant technical investment. Online Poisson calculators and prediction tools offer quicker implementation with less flexibility. Match your approach to your technical skills and time availability.
Update models regularly as new data becomes available. Team quality changes through seasons due to transfers, injuries, tactical evolution, and form fluctuations. Models using stale data produce inferior predictions. Establish updating routines that incorporate recent results while maintaining sufficient historical data for stable estimates.
Document your methodology and track results systematically. Record your probability estimates before matches, the bets you placed, and outcomes. This documentation enables honest assessment of model performance and identifies areas requiring improvement. Without systematic tracking, you cannot distinguish skill from luck.
Accept that even excellent models cannot predict football perfectly. Variance ensures that some well-founded predictions will fail; statistical models provide edges over time, not guaranteed individual outcomes. Size bets appropriately to survive inevitable losing periods while capitalizing on long-term edge.